Riyaz Patel
More services are being rendered to consumers, but less of these services are for free, the 2018 Non-financial Census of Municipalities (NFCM) report has shown.
Released by Statistics South Africa Thursday, the study says the number of consumer units receiving services from municipalities increased between 2017 and 2018.
“The increase in the provision of services by municipalities has enabled many consumer units to have these facilities in their homes for the first time,” said Statistician-General Risenga Maluleke.
The highest percentage increase from 2017 to 2018 in the provision of services was recorded in:
– water (3.7%)
– sewerage and sanitation (3.6%)
– electricity (3.1%) and,
– solid waste management (2.4%).

The highest provincial increases for water, Maluleke said, were recorded in Mpumalanga (6.4%), followed by KwaZulu-Natal (6.1%), while the lowest increase was recorded in the Western Cape (1.8%).
For electricity, the highest provincial increases were recorded in Limpopo (7.5%), followed by Eastern Cape (6.5%), while the lowest increases were recorded in the Free State (0.9%) and Gauteng (1.0%).
The highest provincial increases for sewerage and sanitation were recorded in Eastern Cape (6.2%), followed by Mpumalanga (5.4%), while the lowest increases were recorded in the Western Cape (1.2%) and KwaZulu-Natal (2.0%).
For solid waste management (refuse removal), the highest provincial increases were recorded in KwaZulu-Natal (6.4%), followed by Eastern Cape (3.2%).
Limpopo recorded a decrease of 2.9% in the provision of solid waste management between 2017 and 2018,” Maluleke said.

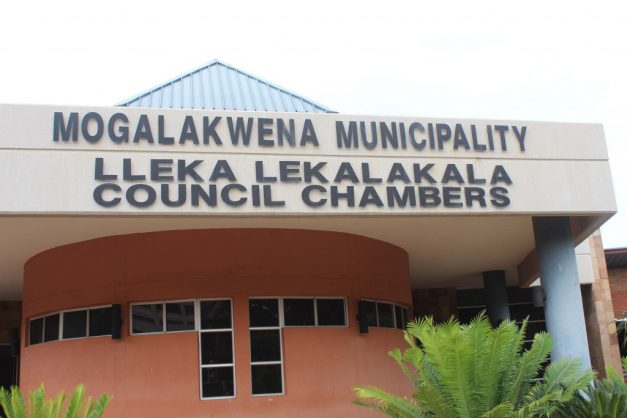
The Mogalakwena and Elias Motsoaledi Local Municipalities mainly contributed to the decrease in the provision of solid waste management due to lack of resources and insufficient trucks.
As a result, these municipalities stopped providing this service in rural areas and focused only on consumer units that paid rates and taxes.
Fewer people getting free basic services
“The differences in the number of consumer units receiving free basic services between 2017 and 2018 are the result of changes in the types of mechanisms used by municipalities to provide such services,” Maluleke said.

The report indicates that free basic services provided to consumer units decreased in all four services (water, electricity, sewage, refuse) between 2017 and 2018 financial years.
The breakdown of figures in the provision of free basic services by municipalities shows a decrease of 661 275 consumer units that received free basic water in 2018, compared to 2017.
Similarly, consumer units received that received free basic sewerage and sanitation in 2018 decreased by 600 815 compared to 2017, and 246 349 fewer consumer units received free basic electricity services in 2018 compared to 2017.
In the case of free basic solid waste management, 160 970 fewer consumer units received the services in 2018 compared to 2017.
According to 2018 estimates, there were 3.6 million indigent households as identified by municipalities.
“Out of this total, 2.8 million indigent households benefited from the indigent support system for water, while 2.0 million benefited from free basic electricity provided by municipalities,” Maluleke said.
The Stats SA chief added that “1.8 million indigent households benefited from the indigent support system for sewerage and sanitation and 2.3 million indigent households benefited from the indigent support system for solid waste management.”
Employment
The report noted that the number of people employed by municipalities increased from 281 787 in 2017 to 282 021 in 2018, inclusive of councillors, mayors and exclusive of vacant posts.
There were 12 268 people occupying posts at management level in all South African municipalities (excluding mayoral, councillors positions and vacancies), with 7 709 of these posts filled by men, while women occupied the remaining 4 559 posts.
There was an increase in the number of funded vacant posts from 45 363 in 2017 to 46 507 in 2018 (including mayoral and councillor positions).
The highest number of vacant posts in municipal departments was in finance and administration (18.7%), followed by public safety (11.5%) and road transport (11.3%).
On the other hand, health and environmental departments reported the lowest vacant posts of 1.9% and 3.5% respectively.


